/
Brand Benchmark

You can see your performance. Now see everyone else's.

Brand Benchmark turns your competitive position into one clear score, built from more than 20 metrics against your real competitors. No spreadsheets. No guessing which metric matters most.

BrandsStatusTM
Homestead
Tracking Data complete · today 21 competitors tracked 327 ASINs 1 seller 3,262 search terms Methodology
ScorecardMarket ShareProductsSellersCompany
0OVERALL
Homestead
# 1 of 12 with data99% confidence
(today)Refresh
ShareExportAI Insights
BRAND SCORECARD

Your position, scored (not just described).

Findability

How often you surface for the search terms your category actually buys on

Conversion

Whether your listing turns browsers into buyers as well as the competitors taking your traffic.

Price

Where you sit against the competitive set, not just your own margin.

Inventory

In-stock consistency and inventory availability against competitors chasing the same demand.

Market Share

The result of the other four areas: are you gaining or losing ground, and by how much.

Every brand sees its own sales. Almost none can see the market around them. Brand Benchmark closes that gap.

Blinking Eye animation
Vision
The full field, mapped by an insider.

Your exact niche, mapped by a Spreetail merchant who knows it, not a category average.

Magnifying glass animation
Insight
Know why, not just what.

When your share moves, Brand Benchmark names the specific competitor move behind it.

Speedometer animation
Insight
Find out in days, not your next QBR.

Daily alerts flag competitor moves as they happen, so you're never explaining a loss you didn't see coming.

Always-On Monitoring

Most tools tell you share moved. Brand Benchmark tells you who moved it.

Competitors reprice, launch promotions, and shift ad spend constantly – and most of those moves are invisible until the damage shows up in your sales. Brand Benchmark's alerts catch the move itself – a price cut, a new promotion, an ad push – so you're reacting to a cause, not a symptom.
Share Movements
Every share movement in this subcategory, newest first. Rows with an attributed cause say so.
MonthBrandEventWhat happenedShare ΔSignal strength
Showing 7 of 15 share movementsMattresses · 24 mo
LOOK BACK TO PLAN FORWARD

A timeline you can explain, not a chart you have to interpret.

See exactly when your share shifted and why – each inflection point mapped to the competitor move behind it – so you walk into your next business review with the answer already in hand.
Homestead · Subcategory market share
Mattresses
$121M subcategory · +10.6% YoY · 7 tracked brands · 15 share movements (15 attributed)
Mattresses12.2% share
Revenue shareUnits share
Homestead share
12.2%Rank #2 of 7 ·
Vs. prior 12 months
+5.8 ptGaining share
Leader
55.2%All others · gap of 43.0 pt
Attributed events
8Explaining 11.5 pt of gross movement
100% Share of Revenue Over TimeReal-ready
Markers flag inflection points. Click one to see what that brand did just before the shift.
Month
Total market revenue
Brand Scorecard

Your position, scored (not just described).

Brand Benchmark turns your competitive position into one clear score, built from more than 20 metrics against your real competitors. No spreadsheets. No guessing which metric matters most.

Findability
How often you surface for the search terms your category actually buys on.
Conversion
Whether your listing turns browsers into buyers as well as the competitors taking your traffic.
Price
Where you sit against the competitive set, not just your own margin.
Inventory
In-stock consistency and availability against competitors chasing the same demand.
Market Share
The result of all four: are you gaining or losing ground, and by how much.
Why Brand Benchmark?

Built on the same intelligence that runs our own merchandising.

Brand Benchmark is not a licensed-only dashboard. We score nearly 400,000 Amazon brands against more than 20 metrics across five pillars, refreshed multiple times a week.

Every competitor set behind those scores is built by the merchant who already manages your account – not something you configure alone. It's already how Spreetail's own team sizes up hundreds of brands today.
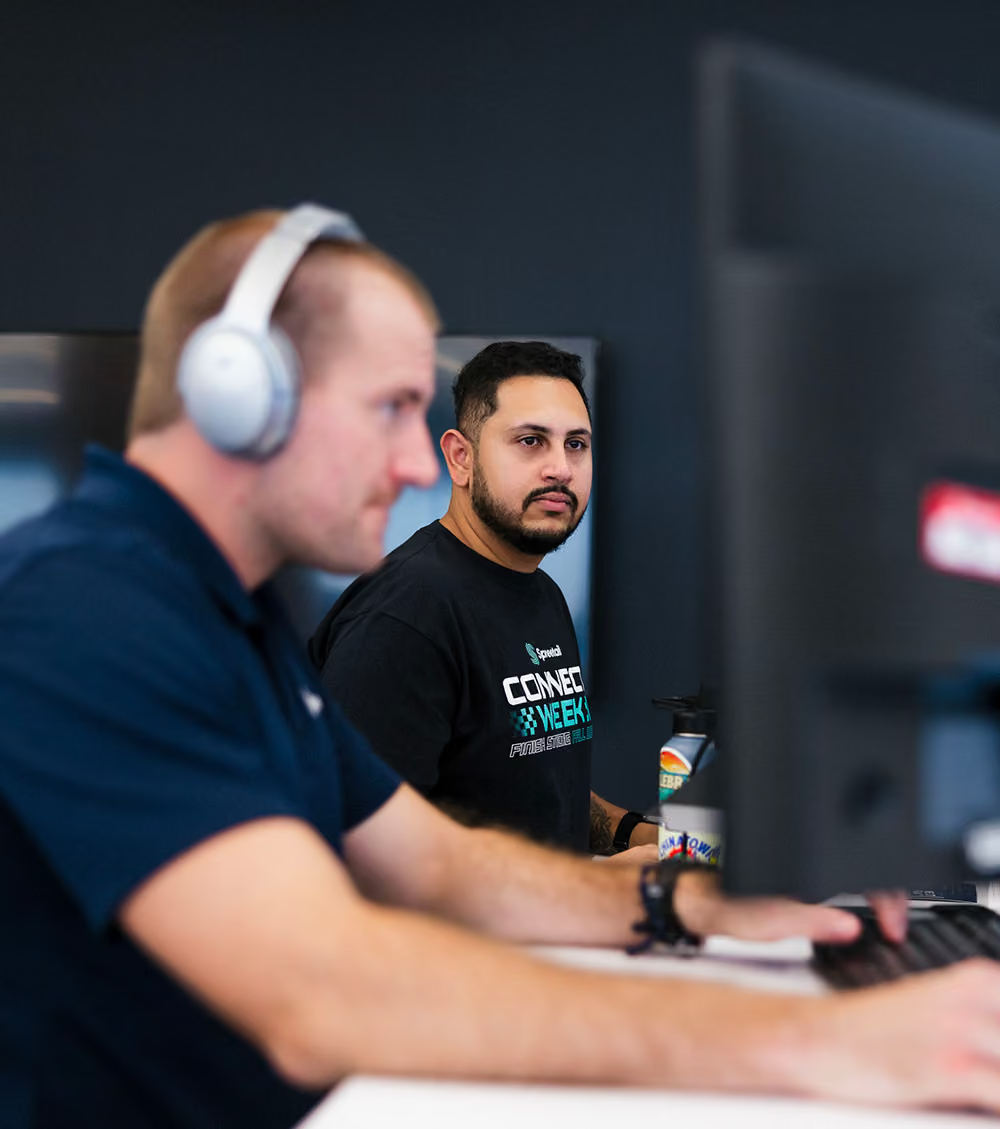
Two men working at desks with computer monitors; the man in the foreground wears headphones and the man in the background wears a black shirt with text and looks at his screen.
~400K

Amazon brands searchable

20+

metrics per scorecard

5

GMV-driving pillars scored

Weekly+

data refresh cadence

Brand Benchmark
DIY Analytics Tools
Causal AI explains why share moved
Reports that share has moved
Niches and competitor sets customized by a merchant who knows your market
Preset categories and filters
Historical inflection points with attributed drivers
Raw trend lines
Proprietary data plus licensed marketplace data
Licensed data only
Delivered inside your existing partnership
Separate monthly subscription
A merchandising team acts on the insight with you
You interpret and execute alone
Included at no extra cost for partners
Subscription required

Control the ecommerce chaos. Command your growth.